About
We connect capital with data.
Remarble is the research platform for Seoul’s living sector. We link Singapore-based institutional capital with Korean living operators, on a data foundation; this site is the public face of that work — the part we publish whether or not you ever become a client.
Capital Market
Remarble Pte Ltd · Singapore
Connecting Singapore-based global institutional investors with Korean operators. Institutional LP coverage, IR and capital introduction.
Data Intelligence
Remarble Inc. · Seoul
Operating Remarble Earth, the Seoul living data platform, with research and advisory for institutions under subscription.
01Earth · v2.4.7 · in service
Seoul living, measured — not estimated.
Remarble Earth is the data platform this magazine is written from: lease-level rent history, operator portfolios, grid-level demand and building-level valuation for the Greater Seoul living sector, used by institutions under subscription. English is the default service language.
earth.remarble.co runs v2.4.7, in service today. Access is by institutional subscription and the platform asks you to sign in; the boards on this site are drawn from the same record and stay free to read.
02The framework
Four layers, in the order the question is actually asked.
An allocator does not start at the building. Each layer answers one question and hands the next one a narrower field, and every layer reads from the same measured base.
- 01
Macro
Is Korea the right market?
68 macro indicators running monthly back to 1960, read as one heatmap across rates, money, prices, production and labour — with a four-phase property cycle model and a sector policy monitor covering tax, lending rules and capital-market funding.
- 02
Region
Which submarket is attractive?
District and legal-dong analytics on a single layered map — monthly rent converted from deposits at 4% so jeonse and monthly leases sit on one comparable series, plus rent growth, price per area, yield, population and net migration, PIR and RIR, permits, visitor demand and lodging supply, each with a year-by-year history.
- 03
Operator
Who operates it, and with whose money?
Operator portfolios, deal structures and the capital network behind them — operator, LP and asset manager on one view. 122 operating assets across 19 operators are geocoded, so the competitive set around any building is a query rather than a phone call.
- 04
Asset
What is it worth?
Fifteen years of building-level lease and sale history, comparables, permit and registry review, cadastral drawings, street-level context and DCF valuation — every registered contract on the building, not a sampled average and not a broker's estimate.
03Inside the platform
Six views, one record underneath.
Screens from v2.4.7, in service today. The city grid, the district, the search across every parcel, the asset, the block and the macro cycle are different readings of the same measured base — which is why a number moves in all of them at once.
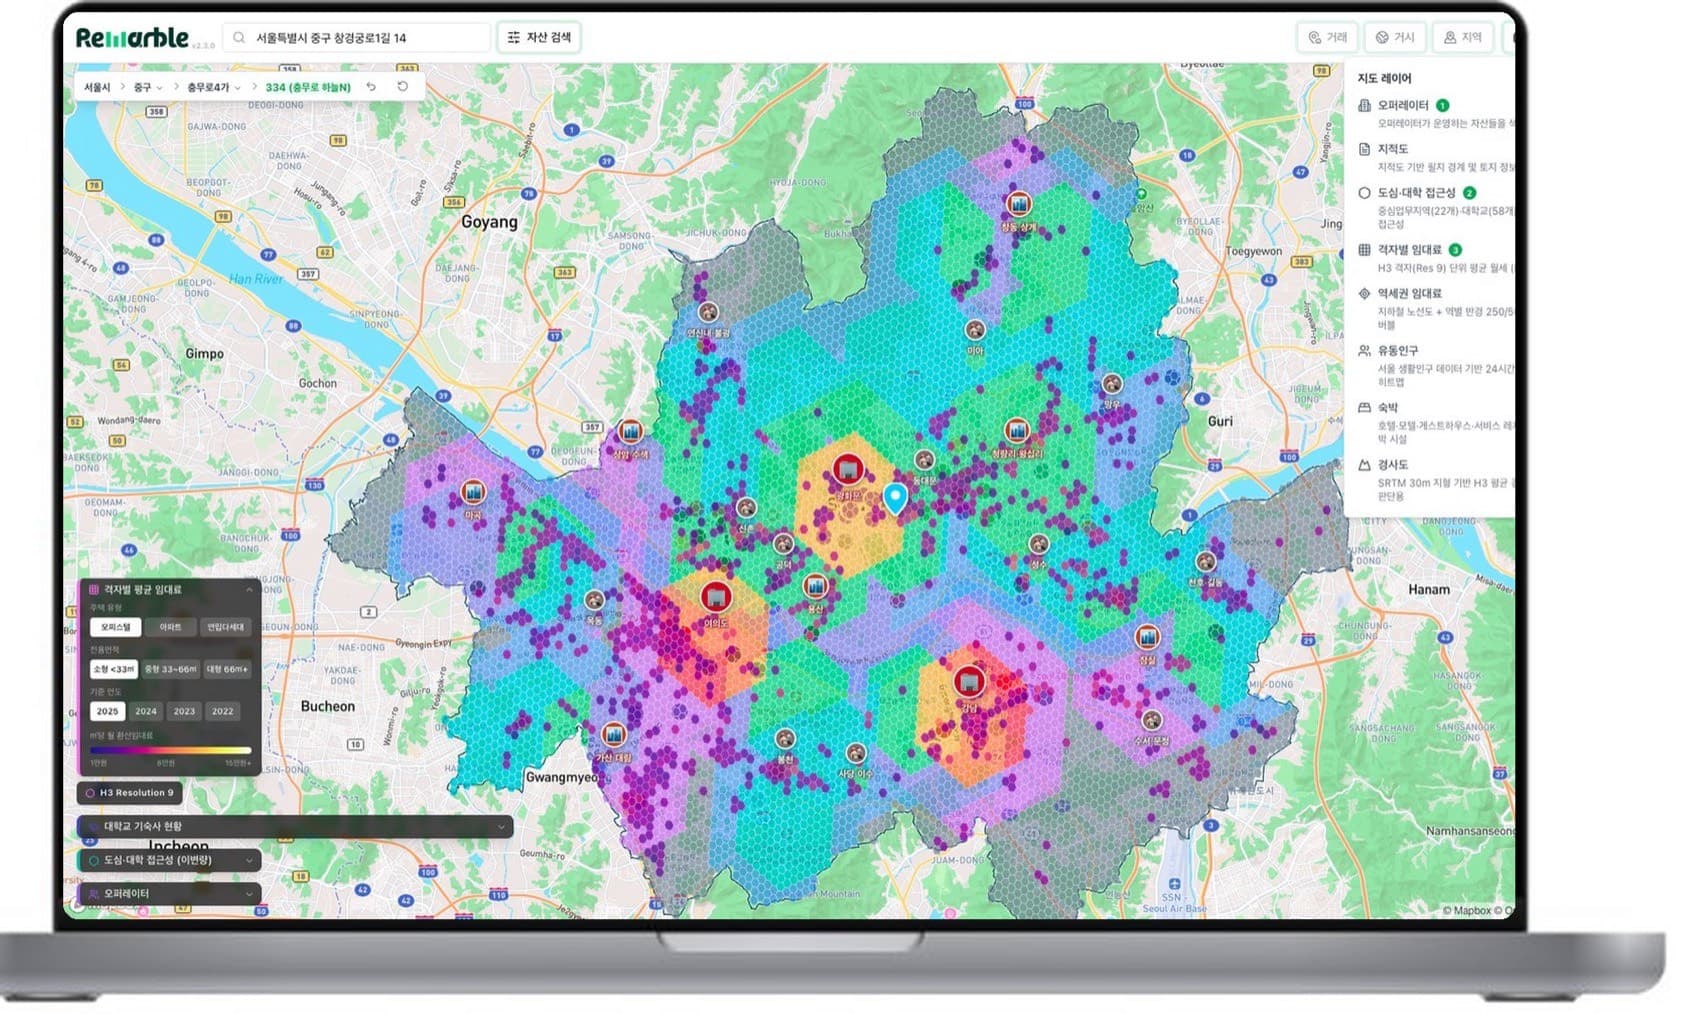
City · multi-layer view
Greater Seoul on an H3 grid — average converted rent per hexagon, filtered by product type, unit size and year, with operators, cadastral boundaries, transit catchments, footfall, lodging supply and slope as layers over the top.
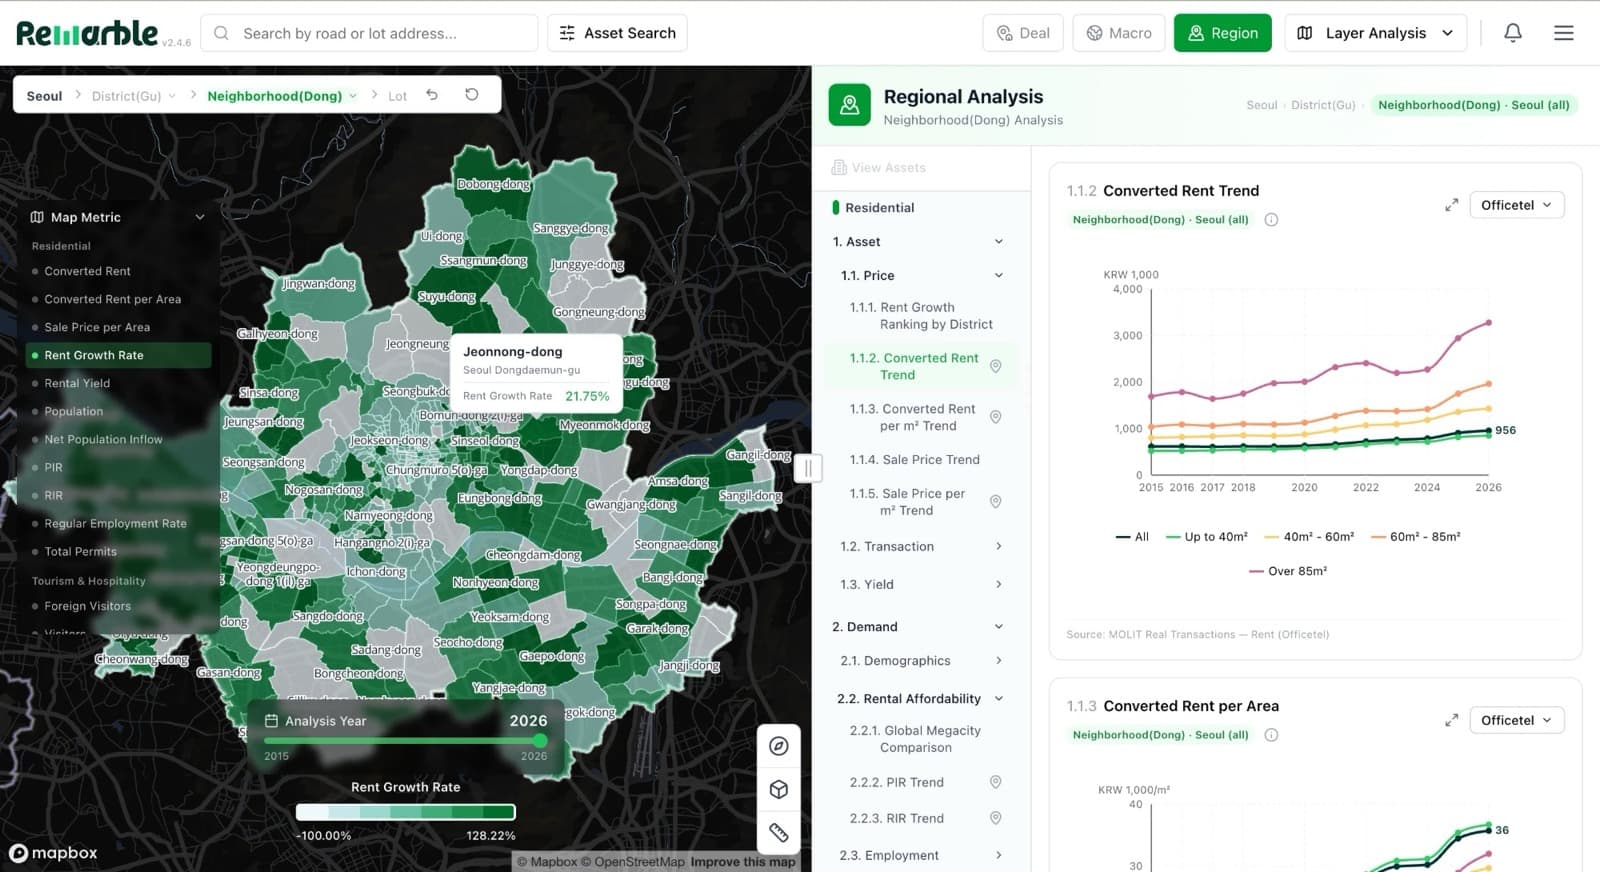
Region · district analysis
The same district read through whichever indicator the question needs — rent, yield, net migration, PIR, RIR, permits, visitor demand — with the analysis structured as assets, then demand, then supply.
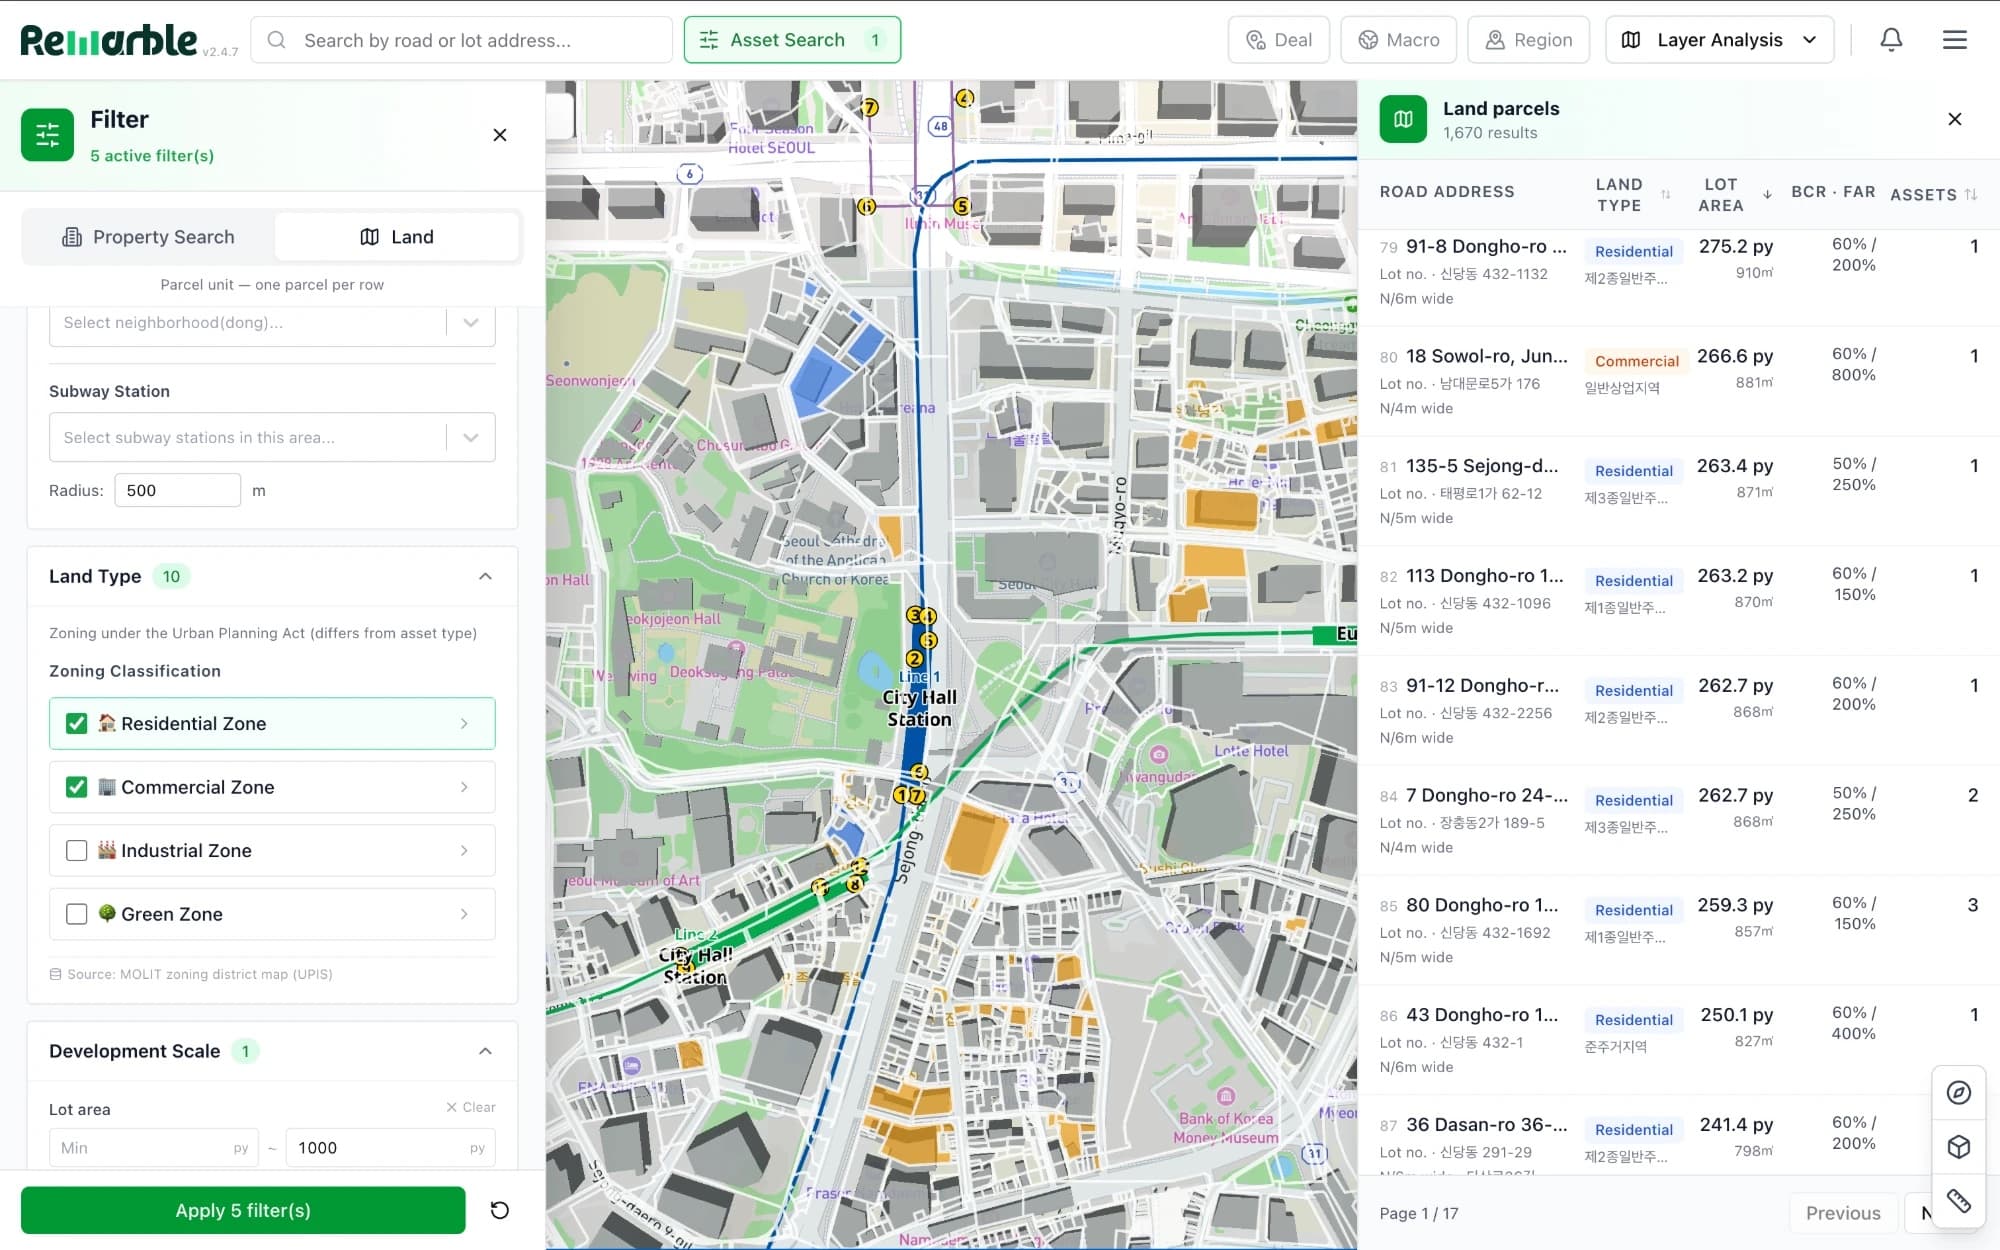
Asset search · land parcels
The whole city screened parcel by parcel — zoning, lot area, road frontage, distance from a station — and returned as a list with each parcel's building coverage, floor-area ratio and the assets already standing on it. Sourcing starts from the land, not from what happens to be listed.
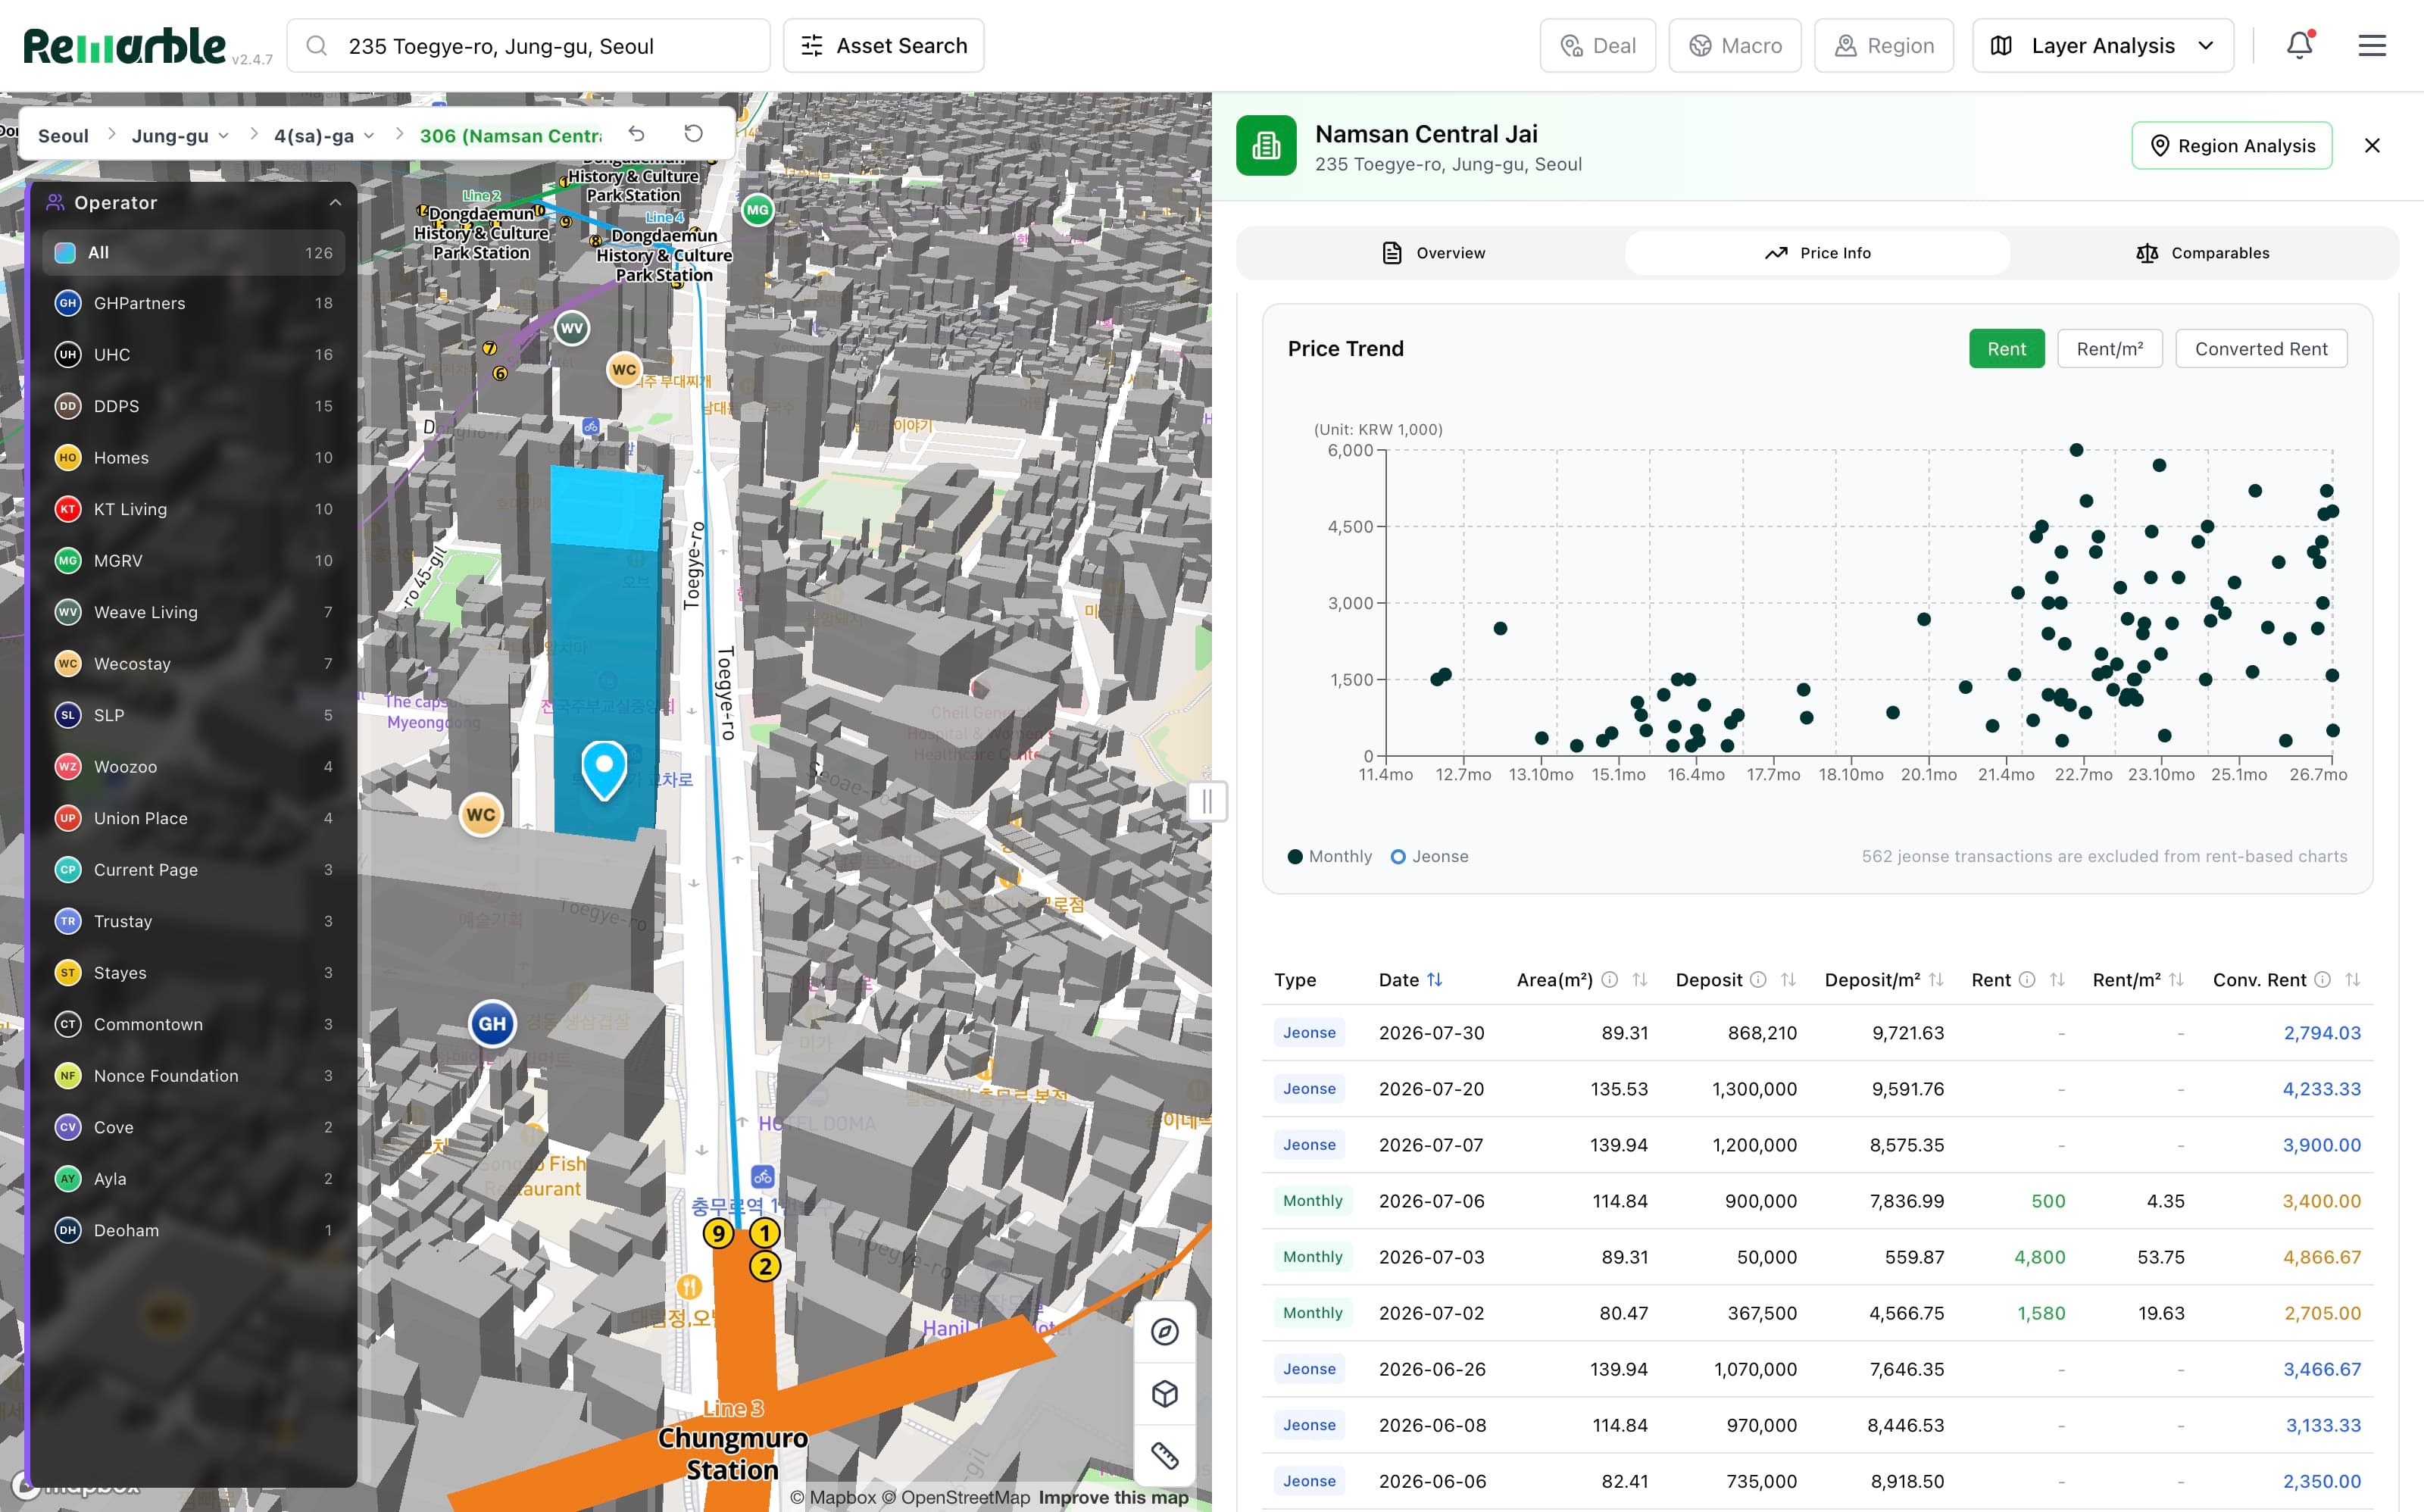
Asset · price information
Every registered lease on one building, deposit and rent converted into a single monthly figure so jeonse and monthly contracts can be read on the same axis. The scatter behind it is the building's own history, not a submarket average.
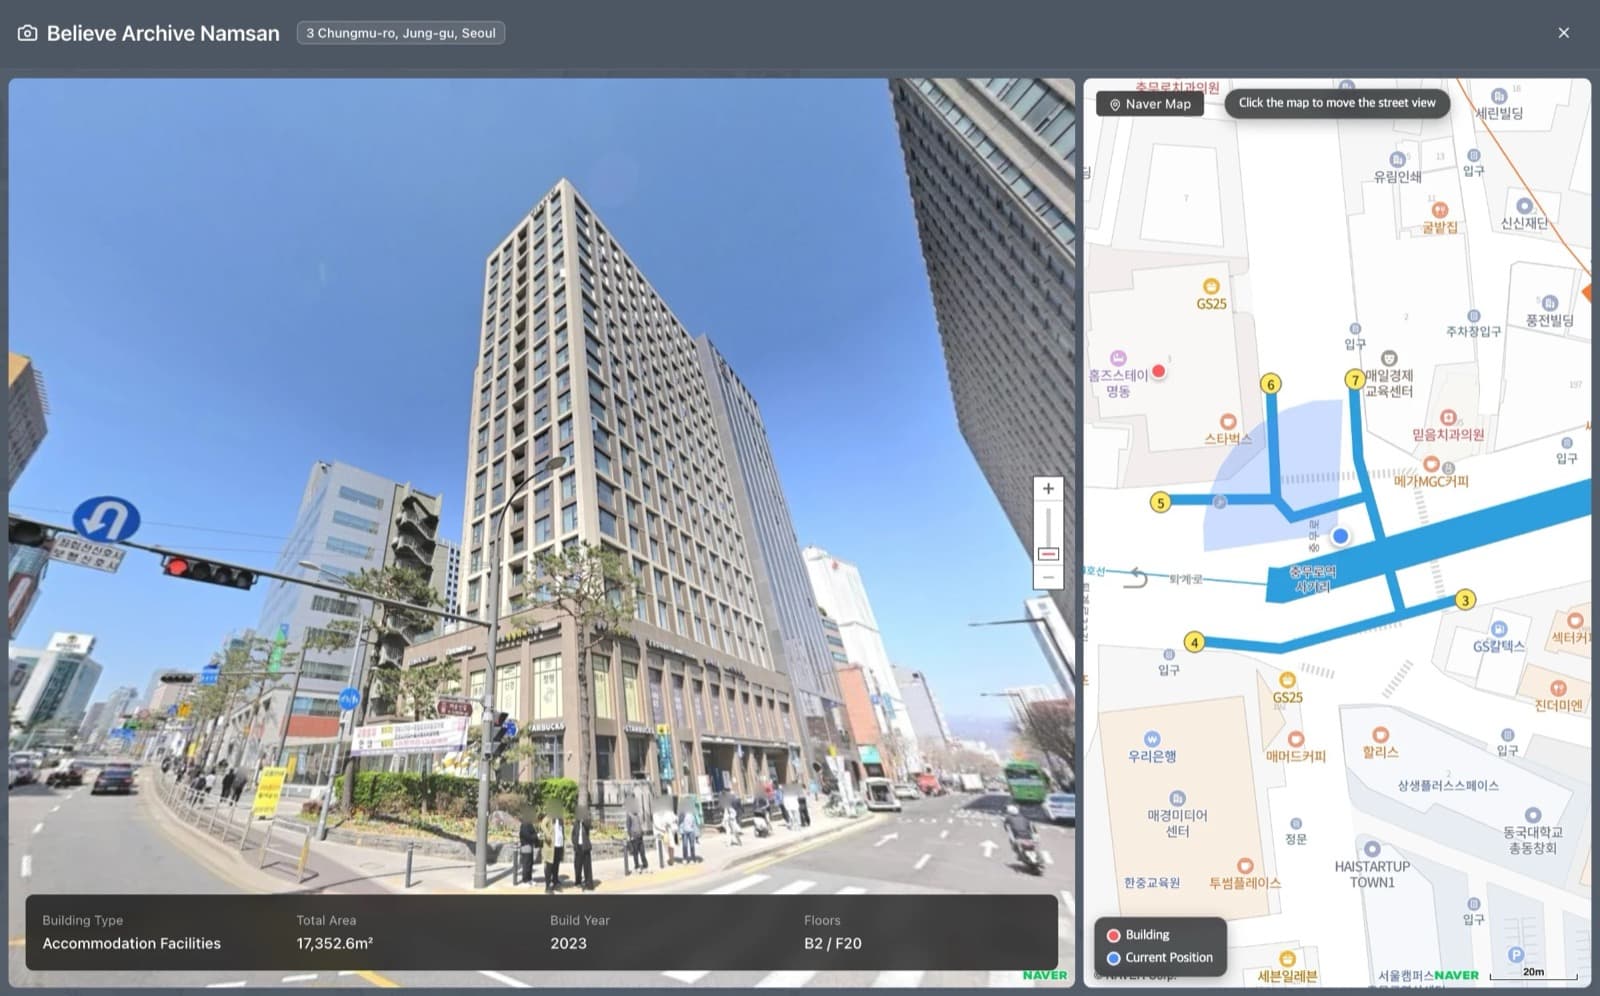
Street · the building in context
The asset photographed from the street, the camera positions along its block, and the building register underneath it. This one is recorded as an accommodation facility rather than housing — the classification, not the marketing, that an underwriter has to work from.
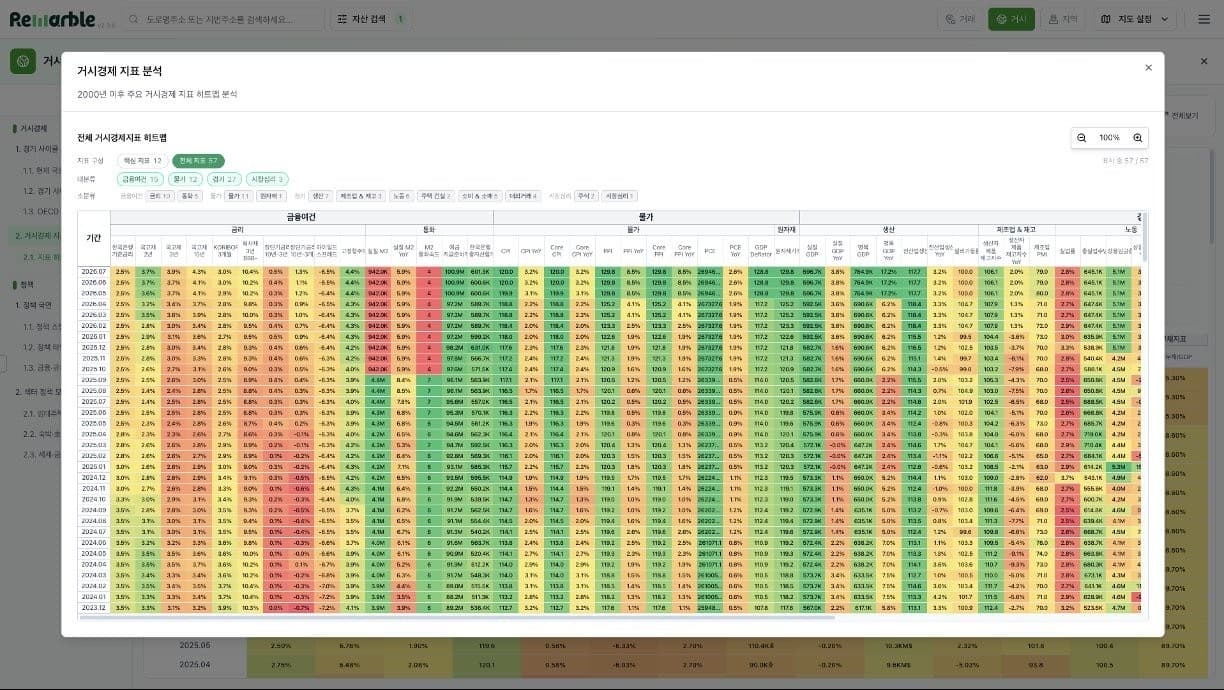
Macro · indicator heatmap
Monthly macro series grouped into financial conditions, money, prices, commodities, production, inventories and labour — colour-scaled so a turn in the cycle is visible before it is narrated.
04The engine
Expert rules and AI agents on one system, with a fixed hierarchy between them.
The useful part of a language model is that it improvises. The dangerous part is the same. Earth keeps both, and never lets the second decide the first.
Symbolic
Expert knowledge, written as rules
Valuation method, law and tax, risk limits. Deterministic, inspectable, and never overruled by a model — if a rule says a structure is not permitted, no amount of confident prose makes it permitted.
Neural
LLM agents, where judgment improvises
Unstructured documents, market read, scenarios. Fast where a rule cannot be written in advance, and never the final word — its output is a proposal the symbolic layer accepts or rejects.
An underwriting system that cannot say why it produced a number is not an underwriting system. Every figure Earth publishes carries the rule it came from and the data it was computed on.
05The path
From a static DCF to a real-time one.
A static DCF fixes all four value drivers at underwriting and revisits them once a year, if at all. The work is to recompute the same four whenever the city moves, with each change carrying its reason.
- 01visualize
Semantic layer
Foundation
gvacNOIr · exitRent, transactions, footfall and spend measured on one grid — every line gets a measured history.
- 02analyze
Ontology and graph
Relationship intelligence
gvacNOIr · exitRent growth and vacancy become functions of the network around the asset — transit, employment, the pipeline next door.
- 03predict
Predictive AI
Neuro-symbolic core
gvacNOIr · exitAll four drivers computed from the state of the city — the graph network proposes, economic law disposes; each driver carries an interval and a trace.
- 04prescribe
Prescriptive AI
Autonomous reasoning
gvacNOIr · exitWhen the city moves the value moves — and the system says which driver moved, and what that does to the decision.
- g
- rent growth
- vac
- vacancy
- NOI
- net operating income
- r · exit
- discount and exit cap rates
A filled chip is a driver computed from the city; an outlined one is still an assumption carried from underwriting. The steps are ordered by dependency — measurement before the graph, the graph before the network that learns on it. This is the build path, not a claim that every step ships today.
06Why it exists
A $3.3tn market allocating capital on numbers nobody measured.
Living is the priority sector and APAC is the fastest-growing region for it. Capital is arriving faster than the underwriting infrastructure that should support it.
- $3.3tn
- APAC commercial real estate
- $250bn+
- into living in 2026, the top-priority sector
- 13.0%
- living share of APAC portfolios, against 33.6% in the US
- +130%
- APAC fundraising year on year, 28% of it cross-border
MSCI
JLL
MSCI, Savills
Colliers
No common data standard
Cross-market data is neither standardised nor collected. Each city is read on its own terms, so a Seoul number and a Tokyo number are not the same kind of number.
One schema across cities
Valued on static assumptions
Underwriting assumptions are set once and rarely revisited. NOI volatility and IRR dispersion go unexplained because nothing measured them in between.
Measured continuously, converging on real time
Decided on personal networks
Relationships institutional capital cannot audit, and that do not travel to a second city.
A platform the allocation can be shown from
07Free vs subscription
What stays open, and what sits inside the platform.
The boards on this site publish the market reference layer — who operates, who invests, how much supply exists and how the macro compares — free and without registration. Asset-level pricing, the full contract ledger and valuation stay in Earth, because that is the work institutions pay for.
Open the free boards →Open on this site
- Operator map and directory
- Capital board — LPs and vehicles
- Deal tracker, parties and dates
- Accommodation supply monitor
- Macro and affordability boards
Inside Remarble Earth
- Lease-by-lease contract ledger
- Building-level valuation and DCF
- Grid-level rents and footfall
- Comparables, permits and registry
- Cadastral drawings and street context
Institutions use Earth for country allocation, submarket screening, partner selection and asset underwriting — and for the monitoring and LP reporting that follow a close.
08Vision 2035
Fragmented markets, one infrastructure.
2026
Seoul pilot
2027
Platform JV
2028+
Tokyo · Osaka
2031+
Sydney · Melbourne
2035
One APAC infrastructure
Contact
Cheolmin Cho · cm.cho@remarble.co