The research platform for Seoul’s living sector
Seoul is the least institutional rental market among APAC’s gateways. That is the opening.
Seoul’s living sector on the record: 19 operators, 122 operating buildings and 42 deals from Remarble Earth, priced against 12 global cities.
Who operates in Seoul?
19
operators tracked
117 of 131 assets placed to a parcel; 15,377 units in operating buildings.
Seoul — the operator map →
Who is funding them?
13
named investors
20 pairings across 7 operators, capital named in full.
Seoul — the capital map →
What has traded?
42
deals recorded
26 dated, 2023–2026. The 16 undated are drawn, not dropped.
Seoul — the capital ladder →
Is Seoul dear or cheap?
29.5x
price-to-income · 4th of 12 cities
Rent burden 25.5%, the lowest of the 12. Tokyo 16.6x, Hong Kong 35.2x.
Macro — affordability →
Where has the stock landed?
Every operating asset on one plate, counted by district. Point at a district or a bar to read it.
- Jung-gu20
- Gangnam15
- Mapo11
- Yeongdeungpo11
- Dongdaemun7
- Jongno7
- Seocho7
- Gwangjin5
- Seodaemun5
- Yongsan5
- Geumcheon4
- Gwanak4
- 13 more districts on the map · none yet: Dongjak, Gangseo, Nowon
Remarble Earth snapshot, as of 2026-09. All 37 macro series last reported together in 2025-12 — sources publish on their own lag.
Insights
Seoul living, read from the record.
Brief
Where Seoul's foreign visitors go — and where the growth is
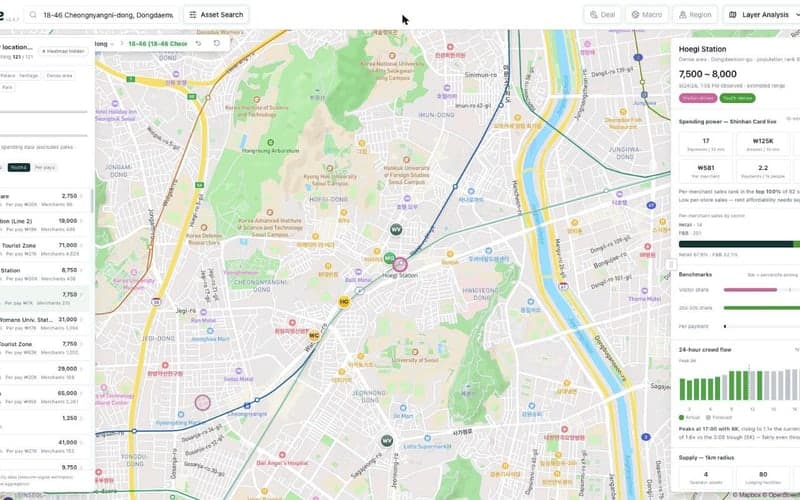
Seoul's flexible-living rooms sell into foreign visitor demand that is concentrated in five districts but growing fastest outside them. Set against the institutional stock and its operators, the visitor data point to one district where demand is rising steeply and operators are few. The data say nothing about occupancy.
Demand · 2026.09.29 · 8 min
Deal Note
Three deals, one kind of address
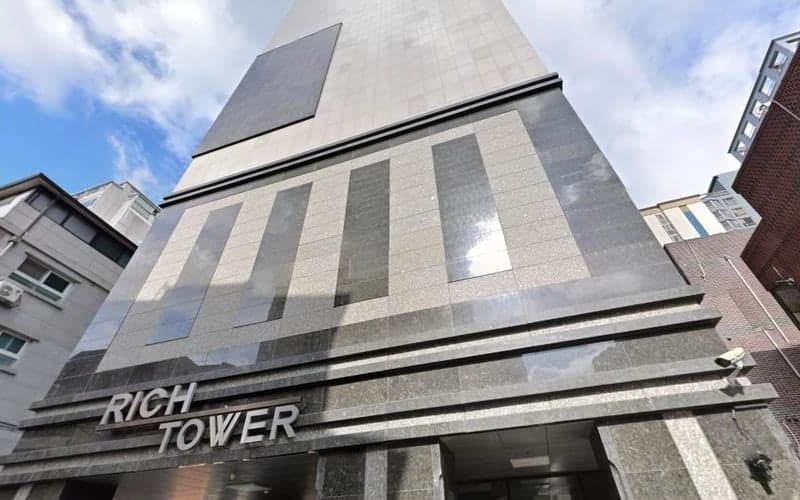
In August a sovereign fund, a pension plan and a domestic asset manager each made a move in Seoul's living sector by a different route. All three chose a university district; Remarble Earth's data shows what they have in common.
Capital & deals · 2026.09.24 · 6 min
Essay
Why now, why Living?
Brokers and fund managers with different mandates each put APAC living among the sectors to favour in their 2026 outlooks. Four established theories of the city explain why, and the source of capital splits one label into four markets.
APAC · 2026.09.24 · 7 min
Essay
Demand, supply, capital
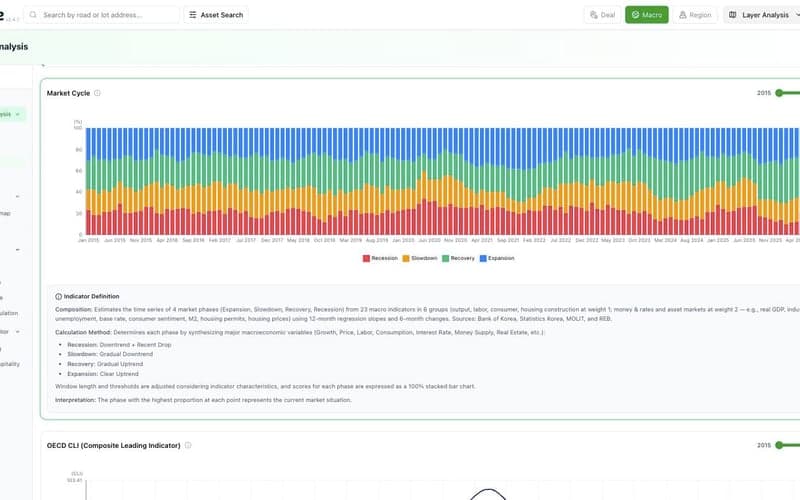
More households in a shrinking city, permits for small units down 75.9% since 2021, and a deposit-based tenure turning into monthly rent. Together they are opening Seoul's rental market to operators and foreign capital.
Demand · 2026.09.24 · 6 min
Deal-note street imagery © NAVER.
Macro
Global megacity positioning — purchase burden against rent burden
The two burdens move independently, so ranking on either alone hides the thing that decides whether a rental market exists. Plotted together, the 12 cities split on the sample means and the quadrant a city lands in is the readable result.
Point at the plot or a city to read its figures.
Seoul sits in the lower right. Buying is hard — 29.5x income, 4th of 12 and above the 21.6x average. Renting is not: at 25.5% of net income it is the lowest burden in the set, against a 57.9% average. A city where a household cannot buy but can comfortably rent is the structural case for institutional rental housing, and it is why this sector exists here at all.
The Seoul Living Brief
One data-led brief on Seoul living, every other Friday.
Written for institutional investors, family offices and operators across APAC. No news round-ups — one structural question per issue, with the data behind it.
Operator profiles
Seoul operators, in depth
3 operating platforms profiled in depth from the material they supplied, published with their sign-off: the headline figures here, the full profile on each operator’s page.
 In-depth profile
WecostayWECO STAY
Flexible living
The company that defined flexible living in Seoul — profitable, on its own numbers
- operating assets in Seoul
- 7E
- units across those assets
- 710E
- rooms nationwide
- 836O
E verified against Remarble Earth · O reported by the operator
Read the profile →
 In-depth profile
Stayes
Student housing
Rebuilding Seoul's campus belt one old building at a time — studios for students and young renters
- operating assets in Seoul
- 3E
- IRR, the Changcheon case study
- 68%O
- target IRR per project
- 20%O
E verified against Remarble Earth · O reported by the operator
Read the profile →
 In-depth profile
DeohamWE STAY
Social development
Korea's social developer: it builds the community first, then stays to run it
- WE STAY homes delivered
- 1,030O
- homes at Noryangjin, completing 2028
- 397O
- WE STAY total project cost
- ₩360.8bnO
E verified against Remarble Earth · O reported by the operator
Read the profile →
Remarble is mandated on these raises — investors reach the deal, the data room and the operator through us. Every figure on their profiles is labelled Earth-verified or operator-reported, and the boards elsewhere on this site are generated from Remarble Earth regardless.
Seoul
Seoul Living Operator Map
Every building we can attribute to a named living operator in Seoul. Filtering by operator, and each building’s name, address and units, open to members — free.
Of 131 assets on file, 122 are operating and 9 announced but not yet operating (hollow markers). The map plots 117; the 14 not plotted have no coordinate, 7 of them announced. Filtering by operator, and each building’s name, address and units, are for members.
Remarble Earth
The database behind this magazine.
Macro, region, operator and asset-level analytics for the Seoul living sector — building-level valuation, transaction history and demand analytics, in English and Korean.